Year in review: insane job market of 2021
Findings from the biggest developer marketplace in Ukraine
Max Ischenko
Dec 16, 2021
The end of the year is an as good a time as any to try to understand what’s going on in the job market and what can we expect from 2022. We spent a week dissecting data we collected from Djinni to figure it out.
What is Djinni? We’re a developers’ marketplace, very popular in Ukraine. More than 50k candidates and 4,000 companies use Djinni every month.
If you have any feedback or questions about this report please contact me on LinkedIn.
Now let’s jump in!
There are (still) more jobs than candidates
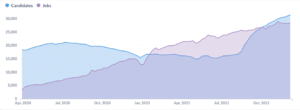
In January the supply-demand curve “flipped” – we have more jobs than candidates.
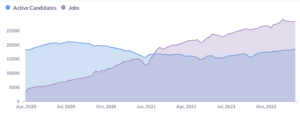
Jobs vs candidates on Djinni: the “big flip” in January 2021.
While this chart may look impressive the real gap between the supply and demand is even bigger – not every candidate is ready/willing to switch jobs and a single job posting often means that the company is trying to fill several similar positions.
The number of jobs posted grew by 2,5 times
There were 315k jobs posted on Djinni this year, compared to 130k in 2020.
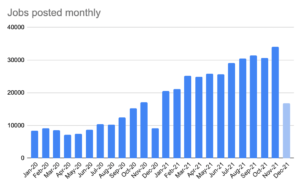
On average 27k jobs were posted every month of 2021
Inbound contact requests are by 3.5 times
When there are more jobs than candidates simply posting a job won’t work most of the time. Outreach – recruiters contacting candidates to discuss job opportunities – is up by 3.5 times compared to 2020.
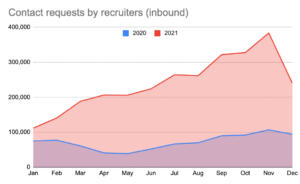
Candidates are flooded with inbound requests from recruiters
In November alone, recruiters sent more message requests to candidates than they did in the first half (!) of 2020!
Each candidate receives 12 messages on average but the distribution is skewed highly to one side – 4% of all candidates receive 37% of all messages – about 50 messages per candidate.
Because candidates are literally flooded with inbound messages the response rate is now down by half – 21% in 2021 vs 37% a year ago.
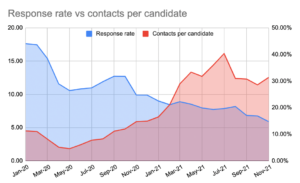
Salaries increased by 20-40%
For most of 2020 there was little to no change in average salaries. They started rising around the end of last year and went wild in May, nicely following the demand curve.
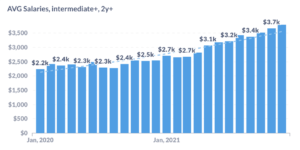
Based on data from actual hires made through Djinni. Excludes candidates with less than two years of experience and/or poor English skills.
The average salary of a candidate hired at Djinni grew by 44% (!) if we compare November 2020 to November 2021. This is insane and can’t continue indefinitely.
The picture becomes more complicated if we categorize hiring data by experience level.
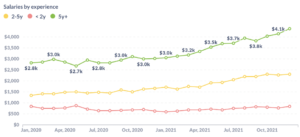
Junior hires didn’t share the spoils of this market.
Junior hires – candidates with less than two years of experience – didn’t share in the spoils of this market. The average salary for junior hire was $770 this year, almost the same as before the pandemic.
Of course averages don’t tell us much so let’s dig deeper.
Salaries by category
The median salary across all categories grew 30% in 2021, excluding junior hires.
Fastest growing median salary: DevOps, .NET, iOS, Python, Node.js.
Highest median salary: Golang, Java, .NET, Node.js.
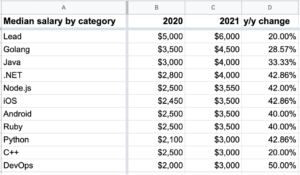
Median salary and y/y change by category in 2021. Full table here.
If we compare the 90th percentile1 the results will look a little different:
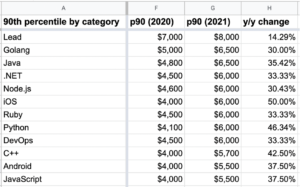
90th percentile and y/y change by category. Full table here.
Fastest growing: iOS, Python, C++, Android, JavaScript.
Highest salary: Golang, Java, .NET, Node.js, iOS.
Note: the table is truncated for clarity, you can access the full data table here.
A few more random tidbits:
1. There were 63 hires for $8000 or more in 2021, up from 11 in 2020.
2. The median salary for candidates with less than two years of experience was $600 in 2021 – exactly the same as it was in 2020.
3. In our Telegram poll, 53% of respondents said they got a “20% or more” raise this year. In another poll, 47% said that they switched jobs this year. Coincidence?
Like it so far? Consider subscribing so you won’t miss our next piece. 👇
Subscribe
Jobs applications are up
Job applications were falling or stagnant for the first half of the year but are now on the rise. In November we saw a new absolute high: 112,290 job applications.
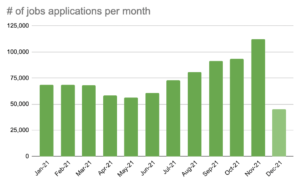
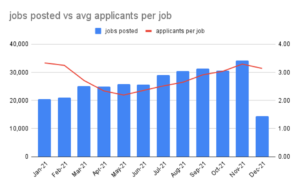
Mostly this can be explained by a record number of jobs posted that month but there is still a non-trivial uptick in the number of job applicants per job, which is a good sign for companies.
Shorter tenures, faster job turnovers
The average time between jobs was 14.7 months in 2021, down from 16.2 in 2020. In reality the average tenure is still shorter, of course – not everyone is changing jobs via Djinni (not yet, at least).
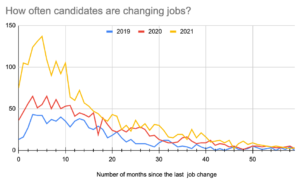
If we plot how often candidates find their next job on Djinni we notice a more pronounced hump in 2021 which also shifted more to the left – this means a shorter tenure.
Out of those who changed a job in 2021 – 29% of candidates stayed at their last workplace for less than six months. In 2020 the figure was 22%.
Demand for recruiters is up by 400%
In 2021 there were 6000 recruiting jobs posted on Djinni, up from 1500 in 2020.
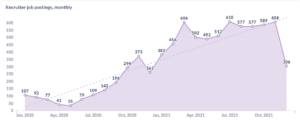
Interestingly, compensation for recruiters didn’t rise significantly –
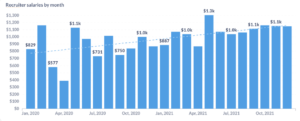
Recruiter salaries hired through Djinni, 2020/2021
The most likely reasons are:
1) There is a significant variable element to recruiters’ compensation so the salary plays a smaller role
2) Many of these hires are for entry level jobs filled by people with little experience who are not paid very well – 42% of all recruiter hires were candidates with less than two years of experience, compared to 33% across all categories.
Everyone wants to hire experienced candidates
70% of jobs posted on Djinni require 2 years of experience or more.
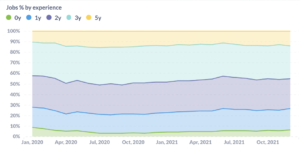
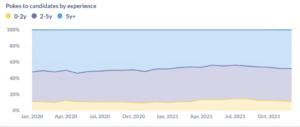
Same with inbound: 90% of message requests are sent to candidates with at least 2 years of experience.
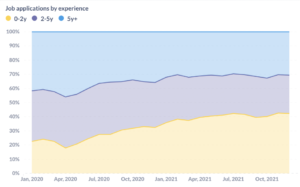
And of course, the people most willing to switch jobs are the less experienced candidates – 40% of all job applications come from candidates with less than two years of experience.
Remote is here to stay
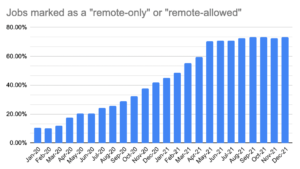
Almost 75% of all jobs posted on Djinni are now marked as remote-friendly.
‘Passive search’ launch
Remember the very first graph where there were more jobs than candidates? Well, I’ve lied. A little.
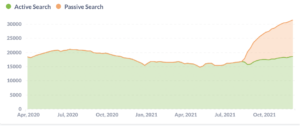
In August we launched a new search mode for candidates, called ‘passive search’, to bring more people to Djinni who are not actively looking. Since August more than 12,000 candidates have enabled it and now there are more candidates than jobs again!
If we re-draw the chart to include candidates with passive search mode we’ll get this:
Look, ma – there are more candidates than jobs! Hiring is back to ‘normal’!
The caveat (and it’s a BIG caveat!) is that these candidates are not actively looking and more like waiting for the right opportunity – which means that they are even less likely to respond if the message isn’t relevant.
Still, there are more than 13,000 new candidates you can reach out to right now.
Djinni is most popular among Ukrainian developers
According to a survey we did on our sister site DOU.ua, 19% of all Ukrainian developers found their latest job on Djinni, up from 15% last year. Djinni is now in the top-3, right behind LinkedIn (20%) and referrals (23%).
Compared to 2020, the share of Ukraine-based candidates declined from 87.72% to 81.86%, as a result of Djinni starting to attract a wider audience.
The top-5 countries where candidates are logging into Djinni in 2021 are:
1. Ukraine (81.86%)
2. Germany (2.17%)
3. Azerbaijan (2.07%)
4. Russia (1.96%)
5. Poland (1.14%)
47% of developers have changed jobs this year, 6% hold two full-time jobs, 16% are employed directly by a non-Ukrainian company
Finally, it’s time for some subjective data.
As part of the community, we run a Telegram channel called Djinni official with 20k subscribers where we run polls, post news and gather feedback.
According to one of our Telegram polls, 47% have switched job this year. Of those, 16% have changed the job several times. According to another poll, fully 6% have two full-time jobs now. And thirdly, 16% said they work directly for a non-Ukrainian company.
If you throw enough money at people eventually they will feel compelled to take it.
Conclusion
2021 was interesting.
You can make an argument that 2021 was a wild outlier, a confluence of several macro trends that aren’t likely to repeat anytime soon: pent-up demand from 2020, the world waking up to the reality that remote actually works, trillions of newly created dollars entering the US economy.
But what if it isn’t? I guess we’ll find out soon enough.
P.S.: Check out our Salaries widget and follow me on LinkedIn for more data & market insights. And of course, subscribe to this newsletter and share it with your coworkers.
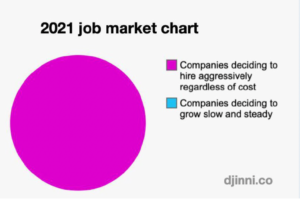
P.P.S.: This chart is as good as any to finish this report.
Thank you for reading and see you in 2022!
 The 90th percentile means that of all the hires made on Djinni no more than 10% are abovethis number.